Mambu Audit Trail Collector for Splunk
Collecting audit data is a great way to correlate all kinds of information so that analysts and auditors will be able to retrieve the necessary information in a timely and efficient manner to investigate a potential fraud or other specific suspicious action.
With that in mind, the purpose of this Splunk Add-On is to bridge Mambu Audit Trail project to understand what the users are doing and how they are using the platform.
Check status/enable Audit Trail API Consumer
To authenticate Audit Trail requests you must use an API key generated by an API consumer of the type ‘audit trail’. So, first of all (and the most important thing) is to check if the API Consumers and Audit Trail features are already enabled.
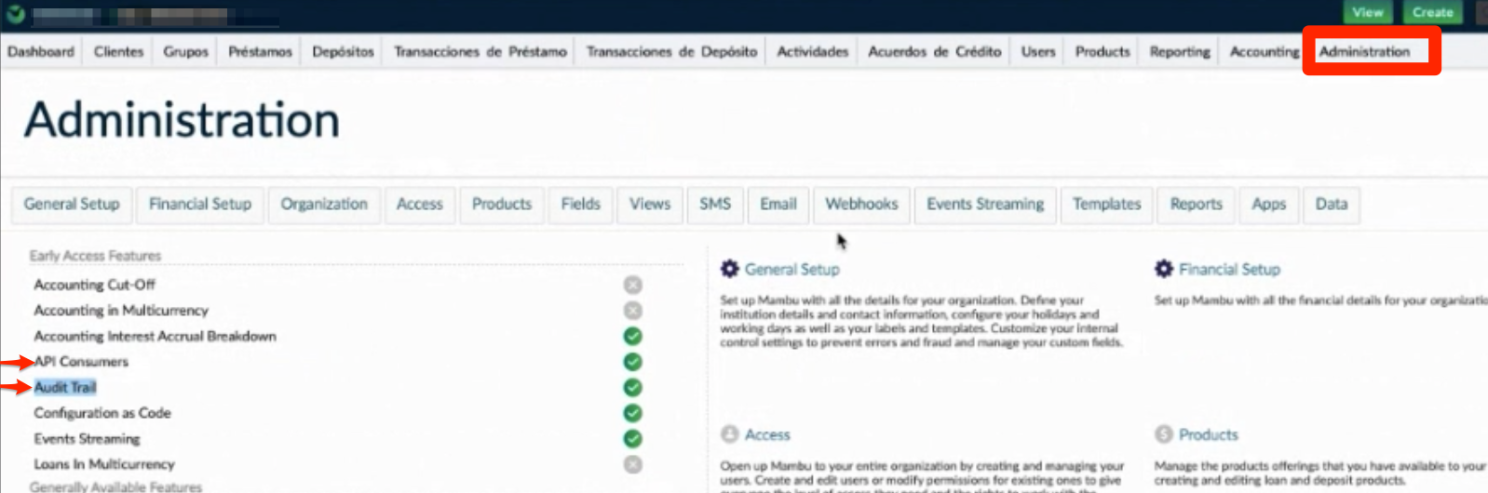
Go to Administration on the top menu bar and verify this.

If for some reason one of the features is disabled, you should contact Mambu support team.
Managing Audit Trail API credentials
You may configure relevant settings in Administration > Access > Preferences
To create an API Consumer:
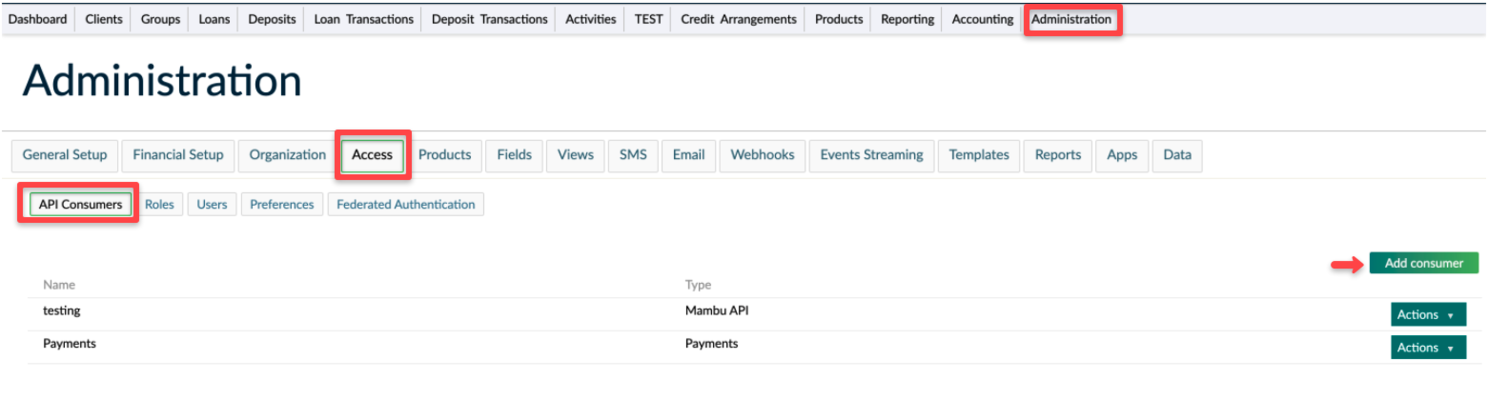
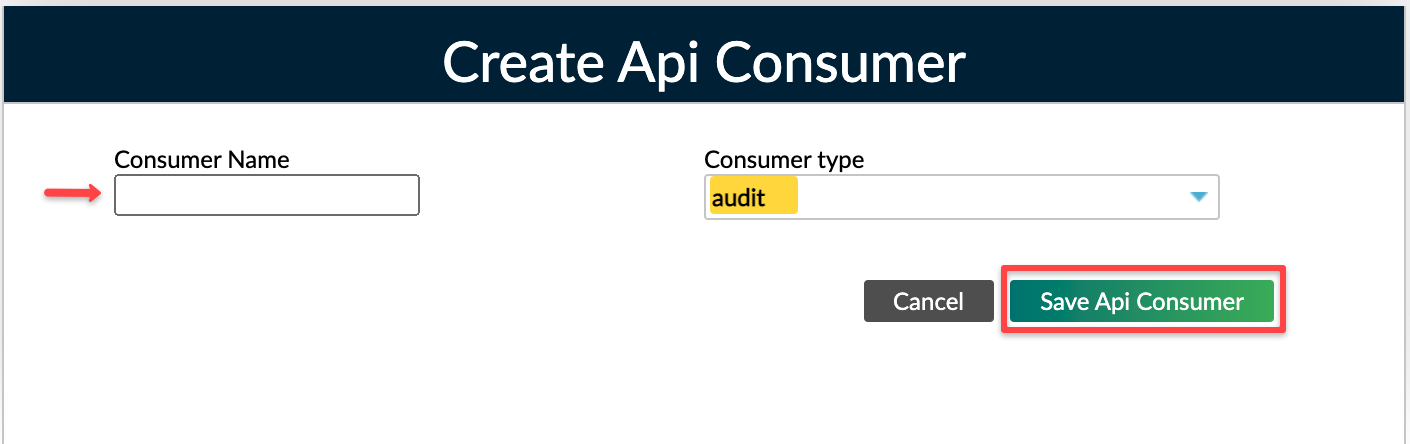
On the main menu, go to Administration > Access > API Consumers Select Add consumer Enter all the necessary information in the Create Api Consumer dialog (Some name and Consumer Type -in our case- Audit) Select Save Api Consumer
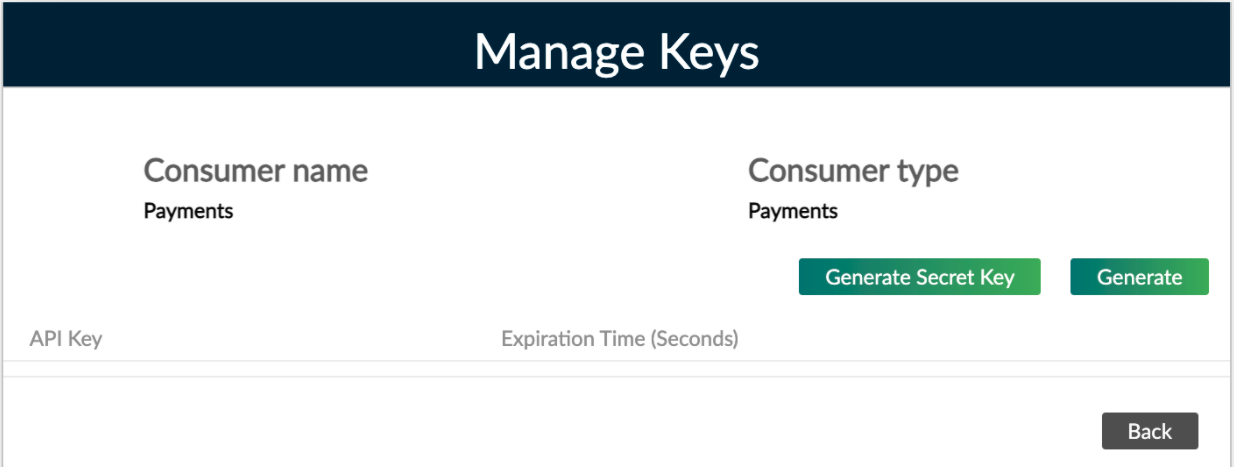
To generate an API key:
On the main menu, go to Administration > Access > API Consumers Find the API consumer in the list that you would like to make an API key for, select Actions > Manage keys In the Manage Keys dialog, select Generate In the Generate New API Key dialog, you can optionally choose whether you want to enter an expiration time to live (TTL) in seconds Select Generate to finish generating the key
Splunk Add-On installation
Download Mambu Audit Trail Collector from Splunkbase
Within Splunk go to Manage Apps menu and click on Install app from file.
Select the Add-On file you’ve just downloaded and click on Upload.
You must restart Splunk server to enable the Add-On.
Step by step Configuration
Once Splunk restarted you will see a new app within the left menu.
Now it’s time to configure our data source (Input). First, click on the Add-On name to access.

Click on Create New Input
Fill the corresponding form and enter your Mambu Audit Trail Endpoint and API Key. Also, you’ll need to select through different event categories (like User Interface / API, Resource and Request Method) to monitor.
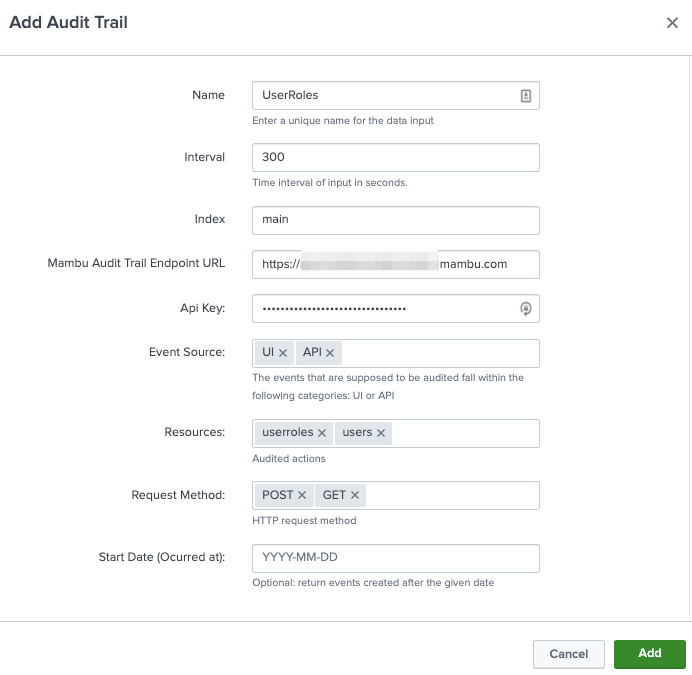
Last, click on Add
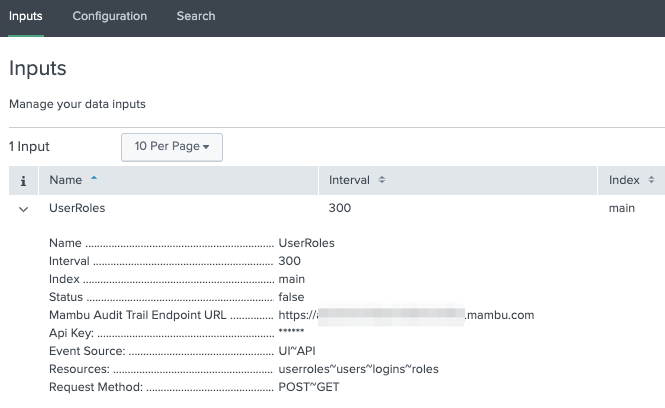
Congratulations! you have successfully configure Mambu Audit Trail Collector input.
And lastly it’s time to run some Splunk searches…
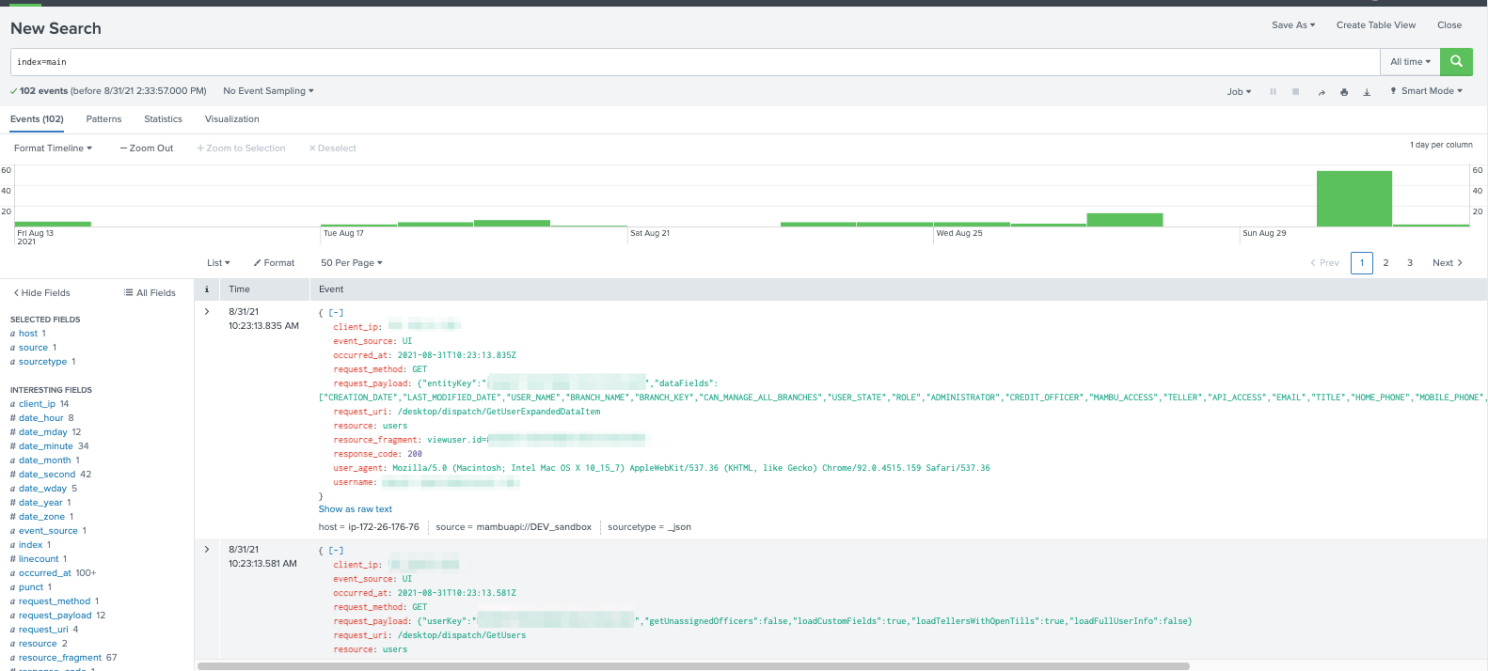
NOTE: Keep in mind that the audit events should be available for making request, as soon as one of the audited action occurs, e.g after a user logs in.
Happy Splunking!!! 😉
Connection Troubleshooting
If you faced timeout issues from the Splunk client host, you’d probably need to validate the IP Whitelisting configuration in your tenant/environment.
To do that, you will need to check the following section: Administration > Access > Preferences, specifically the IP Access Restrictions configuration:
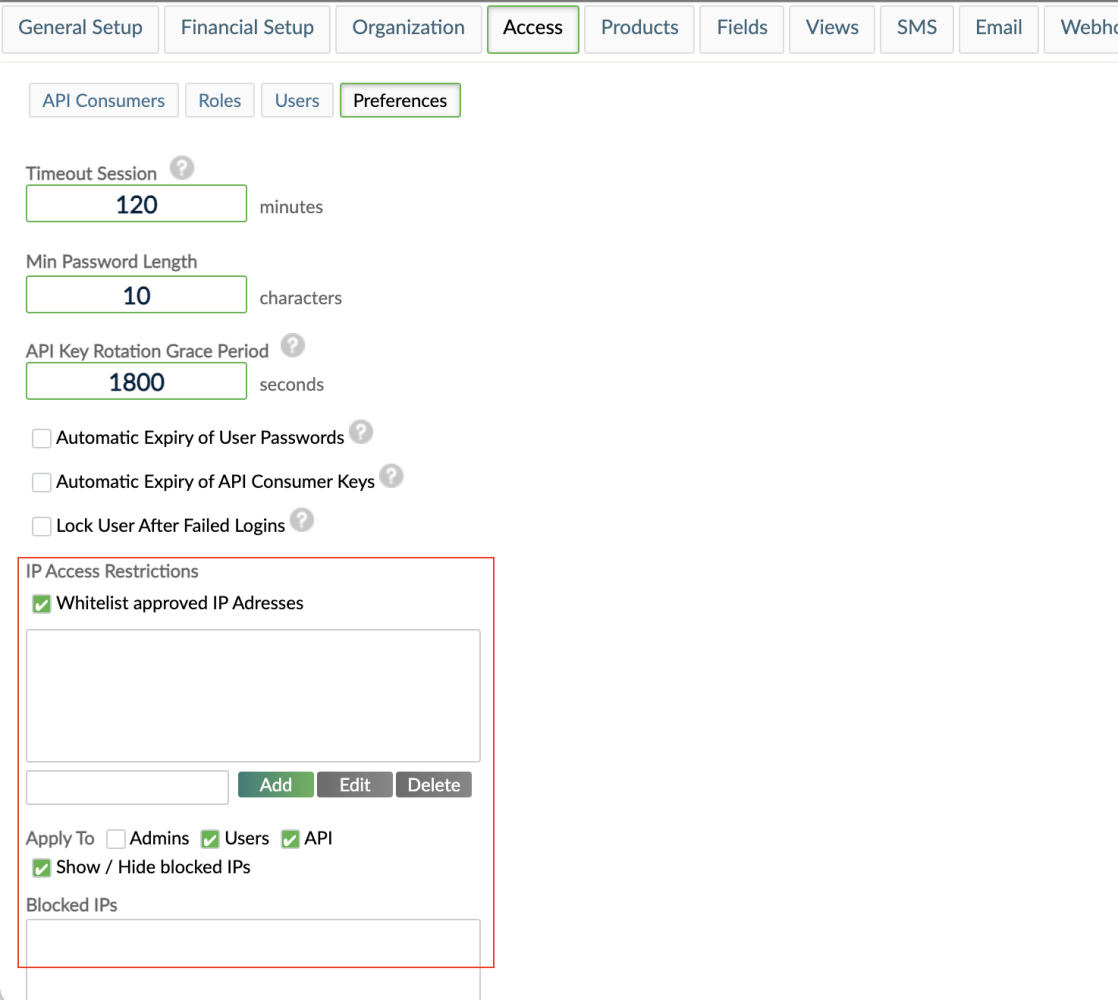
For more information check the Mambu’s Access Preferences documentation